DT/Big Data
Salinity behavior in the Nakdong River estuary (K-water)
Salinity behavior in the Nakdong River estuary (K-water)
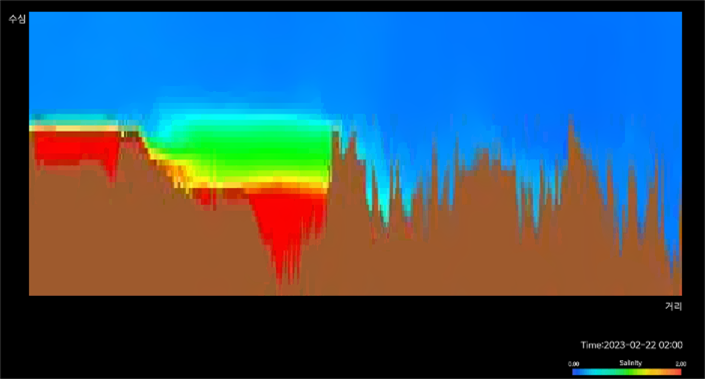
Salinity behavior in a 25km section of the Nakdong River basin was analyzed using real-time measurement information or simulation result information.
A scale model (diorama) of the Nakdong River Estuary installed at the Estuary Integrated Operation Center.
Development of a visualization system that projects salinity behavior analysis images
Promoting the use of the Nakdong River Estuary Integrated Operation Center to support decision-making related to the restoration of the Nakdong River Estuary aquatic ecosystem.
Function 1
Nakdong River Estuary Salinity Information DT Implementation
- Conversion program for salinity behavior
measurement information
- Supports two standard formats (EFDC: .nc &
W2: .bson, etc.)
Function 2
Real-time salinity behavior visualization program
- User color setting function for each salinity
concentration
- Diorama terrain information linked
visualization function
- Display of actual equipment sensor values
through real-time DB server connection
Support H/W
PC
Diorama

Content Image